ABOUT THE PROJECT
CYCLoPs (Collection of Yeast Cell and Localization Patterns) consists of high-throughput imaging screens of yeast GFP-tagged strains, as well as the analysis of protein abundance and localization, which was obtained using support vector machines and convolutional neural networks, as described in Chong et al. and Kraus et al. (Chong et al. 2015; Kraus et al. 2017). The GFP collection was imaged in standard conditions using confocal microscopy, in the presence of 3 chemicals (HU – hydroxyurea; RAP – rapamycin, AF – alpha factor), and one mutant background (deletion of RPD3 gene). Each field of view was imaged in two channels: the green (GFP) channel represents a GFP-fused protein from the ORF-GFP collection (Huh et al. 2003), while the red (RFP) channel identifies the cytosol and was used for cell segmentation purposes. In total, the CYCLoPs dataset covers 4,139 proteins from S. cerevisiae. These proteins have been classified into 16 localization classes.
HOME PAGE
-
To retrieve micrographs, protein localization and abundance data:
- Type in the ORF or common name of the protein(s) of interest. Users are allowed to input more than one protein. Users can also paste in a list of proteins on the search box.
- Hit the search button.
-
For details regarding CYCLoPs, click the About link
-
For the user's guide, click the Help link
-
To download files, click the Supplemental Files link
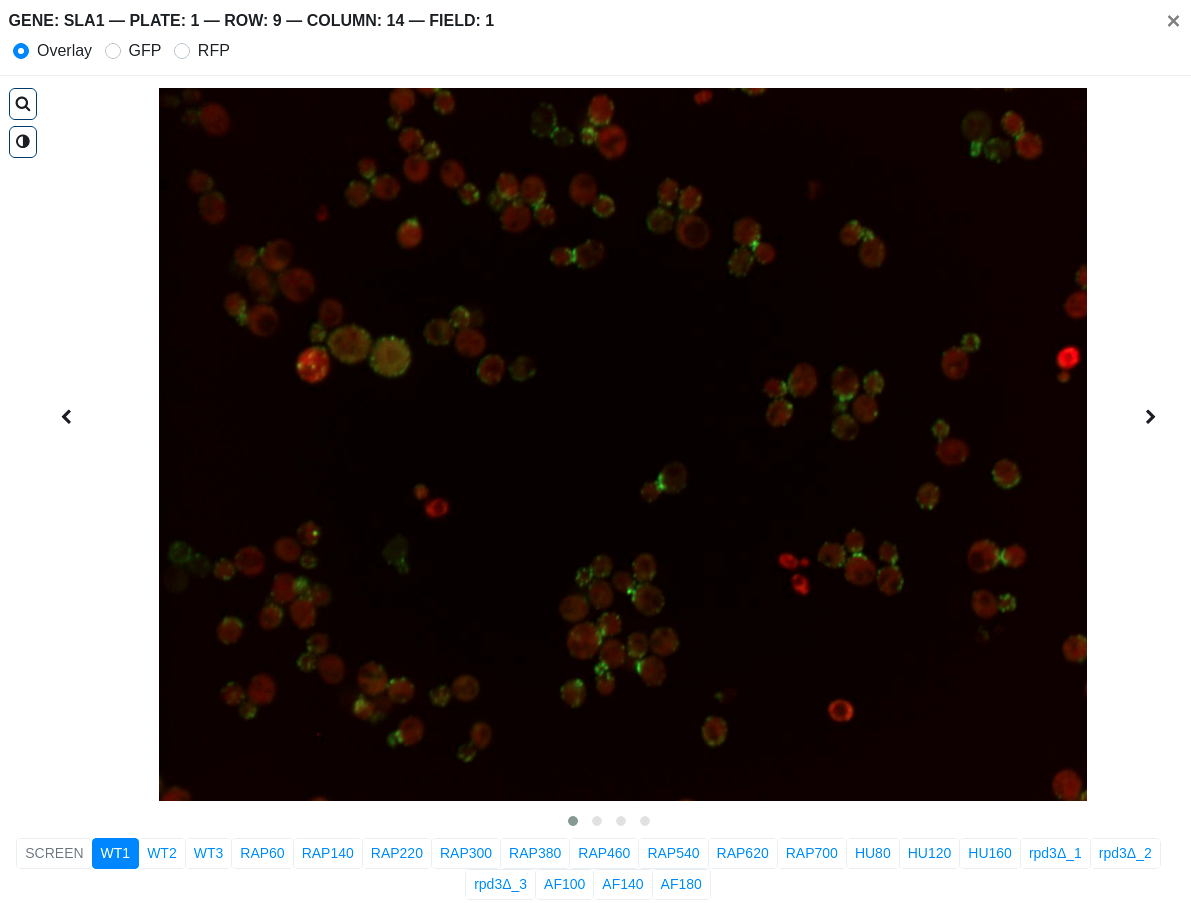
MICROGRAPHS
- Clicking the micrographs thumbnail opens up a modal which contains images from 21 screens.
- Each screen has 4 fields. Slide through different fields by doing
either of the following:
- click the left or right icon
- click the dots at the bottom of the image
- click and hold on the image then swipe left or right
- Toggle channel display by choosing either Overlay, GFP or RFP on the modal header. By default, the overlay image is displayed.
- For a closer look on the cells, enable the magnifying glass by clicking on the icon. To disable it, just click again on the icon.
- To adjust the image brightness, click on the icon and use the slider to increase or decrease the brightness.
SUB-CELLULAR LOCALIZATION
- Displays the LOC-score (quantitative measurement of localization) of the protein in each screen.
- The LOC-score is calculated from the proportion of cells that exhibit morphology specific to a localization class.
- If the column is left blank, it means than insufficient cells were obtained in the screen to make a definitive measurement of localization changes.
- Toggle between LOC-score and Cell count to see percentage vs raw data.
YEAST-GFP LOCALIZATION
- Shows the localization assignment determined manually by 2 annotators in previous study - W.-K. Huh, J.V. Falvo, L.C. Gerke, A.S. Carroll, R.W. Howson, J.S. Weissman & E.K. O'Shea, Global Analysis of Protein Localization in Budding Yeast, Nature, 425, 686-691 (2003).
PROTEIN ABUNDANCE
- Displays the GFP intensity measures of the protein in each screen as a proxy of protein abundance.
- Click the Plot time-course intensity button to open up a collapsible element which shows subplots of intensity levels across time-points for each of the treatment conditions: rapamycin, hydroxy-urea, rpd3 knockout and alpha-factor. Hide the plots by clicking on the button again.
LOCALIZATION CHANGE
- The z-LOC scores quantify changes in sub-cellular compartments with respect to wildtype LOC-scores.
- A negative z-LOC value denotes the exit of a protein from a particular compartment while a positive z-LOC value represents movement towards a specific location.